 |
 |
In MARTI, what does it mean that "the noise pattern is different in every training example"?
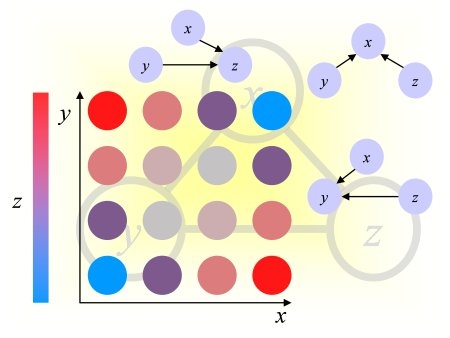
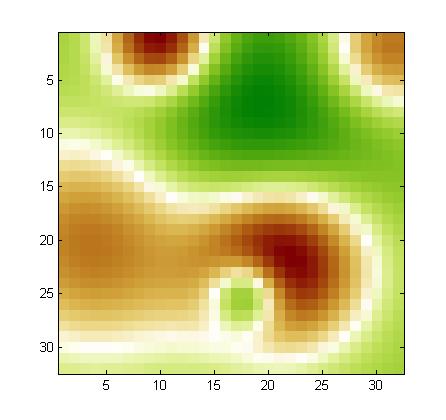
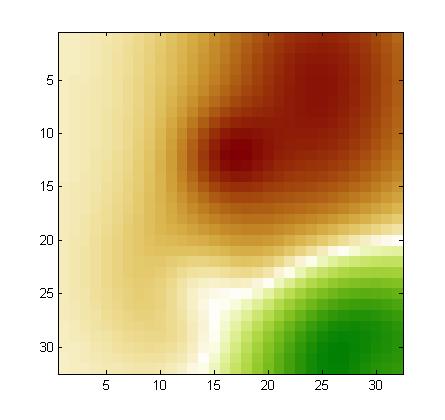
Using our noise model, we drew a noise pattern for every example and added it to that example. When the features are arranged in a 2d 32x32 array (as explained in the documentation), the noise pattern has a smooth structure (neighboring coefficients have similar values). This is kind of background with low frequency. A different noise template is added to each example, but all noise templates are all drawn from the same noise model. If you visualize the training examples after rearranging them as a 32x32 array, you will see this right away. For each feature, the expected value of the noise is zero. But the noise of two neighboring features is correlated. We show below examples of noise patterns (positive values in red and negative values in green).
In MARTI, what does it mean that 25 "calibrant features" have value
zero plus a small amount of Gaussian noise? The averages for every calibrant feature is far from zero.
We have 2 kinds of noise. The calibrants are 0+-[small Gaussian noise]. Then, on top of that, in training data only, we add the correlated noise model. After we add the correlated noise, because of the small sample size and the large variance, the calibrant values are no longer close to zero (even on average) in training data. However, the median is close zero on average for almost all calibrants, relatively to the signal amplitude: abs(mean(median(X(:,calib))/std(abs(X(:)))))~e-005.
In training data, we get:
mean(abs(mean(X)))~e+004 but and mean((mean(X(:,calib))))~5e+003.
In test data, because we did not add noise, the calibrant values are close to zero, relatively speaking: mean(abs(mean(X)))~5e+003 but mean(abs(mean(X(:,calib))))~1.
The calibrants can be used to preprocess the training data by subtracting a bias value after the low frequency noise is removed, so that the calibrant values are zero after preprocessing the training data.
REGED and MARTI do not look like regular microarray data. What kind of normalization did you do?
REGED was obtained by fitting a model to real microrray data. REGED features were shifted and rescaled individually then rounded to integer spanning the range 0:999. MARTI was obtained from data generated by the same model as REGED without rescaling features individually. For MARTI, a particular type of correlated noise was added. The data were then scaled and quantized globally so the features span -999999:999999.
We chose to make the noise model simple but of high amplitude to make it easy to filter out the noise but hard to ignore it.
If you think of the spots on a microarray as an image (MARTI patterns are 32x32 "images"), the noise in MARTI corresponds to patches of more or less intense values, added on top of the original image, representing some kind of slowly varying background. Nowadays, microarray technology has progressed to a point that such heavy backgrounds are not common and occasional contaminated arrays would not pass quality control; furthermore microarray reading software calibrate and normalize data so you would not see data that "bad". But for new instruments under development, such levels of noise are not uncommon.
MARTI illustrates the fact that if you do not take out correlated noise, the result of causal discovery may be severely impaired. Even though the amplitude of the noise is large, the noise is easy to filter out, using the fact that neighboring spots are affected similarly, and using the spots having constant values before noise is added (calibrants). After noise filtering, the residual noise may still impair causal discovery, so it its your challenge to see what can be done to avoid drawing wrong conclusions in the presence of correlated noise.
Why
are there no multiclass and regression tasks?
There will eventually be some. We are working on including more datasets.
I do not see my results in the "Overall" table, what's wrong?
An entry must be "complete" to be displayed in the "Overall" table., i.e. have results for the 3 test sets 0,1,2 for at least one task (for instance REGED0, REGED1, and REGED2). You must upload these results in a single archive, otherwise they count as separate entries.
I
see xxxxx in the result tables, is there a problem with the display?
No, during the development period, we show only results for LUCAS and LUCAP,
the toy datasets, which are just used as examples and do not count for the
competition. The other results will be revealed at the end of the challenge.
I get the message Error with the contents of the archive, missing compulsory file(s), or no valid file found but I verified my files are correct, what's wrong?
The server expects lowercase file names, check this this correct.
Is
there a limit to the number of submissions?
You can make as many submissions as you want (albeit
no more than 5 per day in order not to overload our system.) Only
the last submission of each entrant will count towards competing for the
prizes.
Can
I use a robot to make submissions?
Robot submissions are not explicitly forbidden. However,
we require that the total number of submissions per 24 hours from
the same origin does not exceed 5. Please be courteous otherwise we
run at risk of overloading the server and we would then need to take
more drastic measures.
Can
I use an alias or a funky email not to reveal my identity?
To enter the final ranking, we require participants
to identify themselves by their real name. You cannot win the
competition if you use an alias. However, you may use an alias
instead of your real name during the development period, to make development
entries that do not include results on test data. You must always
provide a valid email. Since the system identifies you
by email, please always use the same email. Your email will only be used
by the administrators to contact you with information that affects the
challenge. It will not be visible to others during the challenge.
Do I need to let you know what my method is?
Disclosing information about your method is optional
during the development period. However, to participate to the final ranking,
you will have to fill out a fact sheet about your method(s). We
encourage the participants not only to fill out the fact sheets, but write
a paper with more details. A best paper award will distinguish
entries with particularly original methods, methods with definite advantages
(other that best performance) and good experimental design.
Can
I make a submission with mixed methods?
Mixed submissions containing results of different
methods on the various datasets are permitted.
How
will you enforce the rules of the challenge?
There are two rules, which we will enforce with post challenge tests:
Would it be O.K. to submit predictions made using
the same form of model (e.g. ridge regression) but with several different feature
selection algorithms?
We want a single submission for each task and give the degree of freedom of providing multiple prediction results only to report results on nested subsets of features. However, you can generate the feature order any way you want (e.g. you can put first the direct causes, then the other members of the MB, then the most correlated features, then all other features). The ordering can come out of a hybrid strategy between the results of several feature selection and causal discovery techniques. Then, you can make nested subsets and train a classifier on each subset and turn in the results as a table. To make things comparable, we asked people to vary the subset sizes by powers of 2. This does not necessarily cut at an optimum point, but this will facilitate making comparisons between methods.
Can
I participate in the competition if I cannot attend the workshop?
Yes.
Can
I attend the workshop if I do not participate in the challenge?
Yes. You can even submit a paper for presentation
on the themes of the workshop.
Why
do you not have a validation set?
In past challenges, we used to given feed-back during the development
period on a validation set. Then, we disclosed the target values on that
set and used a different "final" test set for ranking participants.
We adopted a different setting in this challenge because disclosing
validation targets would reveal information on the test set distribution,
which we do not wish to reveal.
Instead, we give partial feed-back directly on the test set, via "quartile"
information.
What
motivates the proportion of the data split?
The size of the training set corresponds to realistic amounts of training
data available in real applications, yet the data are sufficient to uncover
causal relationships at least to a certain extent. The test set was made
large enough to get small error bars on the prediction error for the methods
we have tried.