LUCAS
and LUCAP are lung cancer toy datasets
LUCAS and LUCAP are modeling a medical application for the diagnosis, prevention, and cure of lung cancer.
Download the data (challenge format).
Download LUCAS0 train (CSV) (format suitable to run the U. Pittsburgh web app)
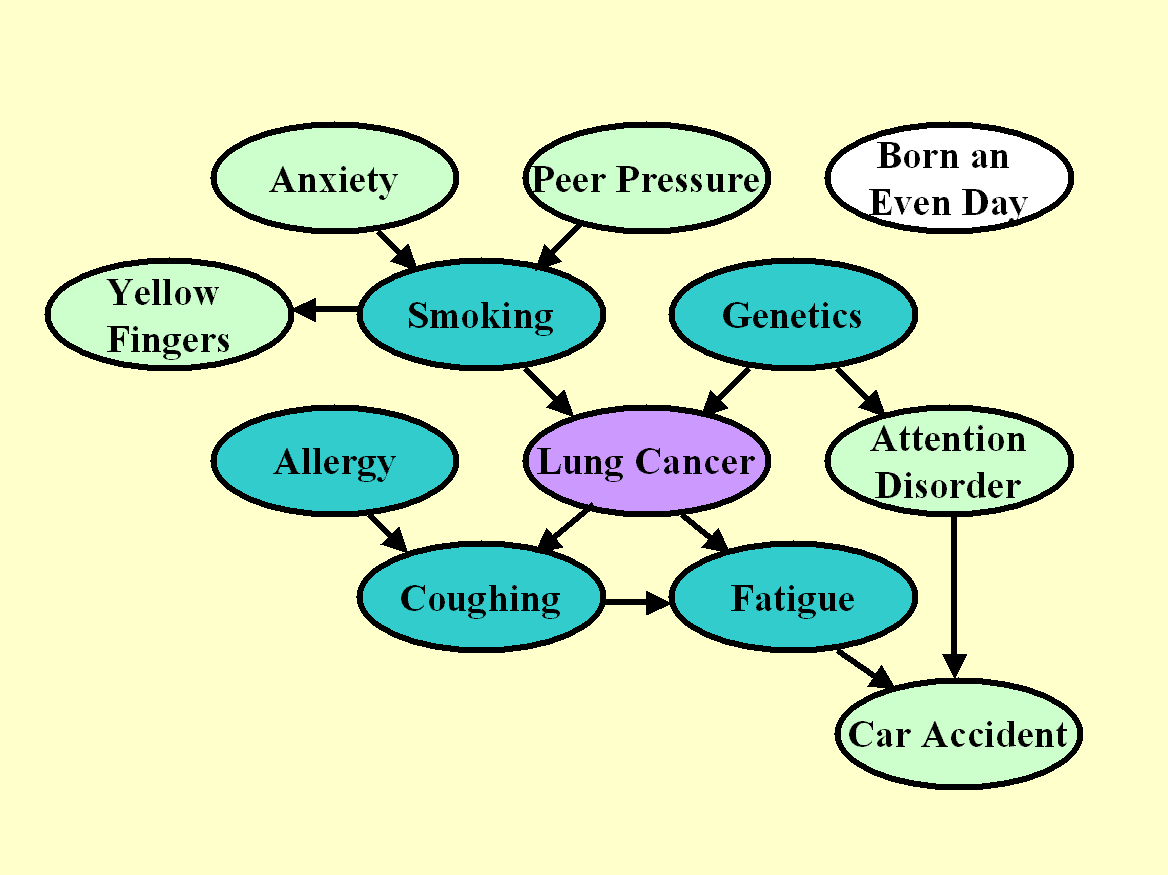
Figure 1: Graph for the
unmanipulated distribution of LUCAS0.
The target variable is shaded in purple. The nodes in dark green constitute
the Markov blanket of the target variable.
The target variable is shaded in purple. The nodes in dark green constitute
the Markov blanket of the target variable.
We show the graph of the generating process of LUCAS0 in Figure 1. Each node represents a variable/feature and the arcs represent causal relationships. We number the variables from 0, where 0 is the target variable: Lung Cancer. The other variables are numbered in the order of the columns of the data tables of LUCAS:
1: Smoking
2: Yellow_Fingers
3: Anxiety
4: Peer_Pressure
5: Genetics
6: Attention_Disorder
7: Born_an_Even_Day
8: Car_Accident
9: Fatigue
10: Allergy
11: Coughing
Each node in the graph is associated with the following conditional probabilities, which we used to generate the data:
P(Anxiety=T)=0.64277
P(Peer Pressure=T)=0.32997
P(Smoking=T|Peer Pressure=F, Anxiety=F)=0.43118
P(Smoking=T|Peer Pressure=T, Anxiety=F)=0.74591
P(Smoking=T|Peer Pressure=F, Anxiety=T)=0.8686
P(Smoking=T|Peer Pressure=T, Anxiety=T)=0.91576
P(Yellow Fingers=T|Smoking=F)=0.23119
P(Yellow Fingers=T|Smoking=T)=0.95372
P(Genetics=T)=0.15953
P(Lung cancer=T|Genetics=F, Smoking=F)=0.23146
P(Lung cancer=T|Genetics=T, Smoking=F)=0.86996
P(Lung cancer=T|Genetics=F, Smoking=T)=0.83934
P(Lung cancer=T|Genetics=T, Smoking=T)=0.99351
P(Attention Disorder=T|Genetics=F)=0.28956
P(Attention Disorder=T|Genetics=T)=0.68706
P(Born an Even Day=T)=0.5
P(Allergy=T)=0.32841
P(Coughing=T|Allergy=F, Lung cancer=F)=0.1347
P(Coughing=T|Allergy=T, Lung cancer=F)=0.64592
P(Coughing=T|Allergy=F, Lung cancer=T)=0.7664
P(Coughing=T|Allergy=T, Lung cancer=T)=0.99947
P(Fatigue=T|Lung cancer=F, Coughing=F)=0.35212
P(Fatigue=T|Lung cancer=T, Coughing=F)=0.56514
P(Fatigue=T|Lung cancer=F, Coughing=T)=0.80016
P(Fatigue=T|Lung cancer=T, Coughing=T)=0.89589
P(Car Accident=T|Attention Disorder=F, Fatigue=F)=0.2274
P(Car Accident=T|Attention Disorder=T, Fatigue=F)=0.779
P(Car Accident=T|Attention Disorder=F, Fatigue=T)=0.78861
P(Car Accident=T|Attention Disorder=T, Fatigue=T)=0.97169
(these values have no biological meaning, they are completely made up).The generative model is a Markov process, so the state of the children is entirely determined by the states of the parents. The values must be drawn in a certain order, such as the one given above, so that the children are evaluated after their parents.
Both the training and test sets of LUCAS0 are drawn according to that distribution, which we call "unmanipulated". We outline in dark green the nodes, which are part of the Markov blanket of the target, which includes all parents, children, and spouses of the target. The Markov blanket (MB) is the set of variables such that the target is independent of all other variables given MB. In other words, if you were capable of learning the graph architecture and the conditional densities perfectly, you could make perfect predictions of the target with only the variables in MB. But with a finite training set, you may be better off using more predictive variables, including other ancestors and descendants.
As an indicator of the efficiency of your feature selection process, we compute a score (Fscore), which indicates how well your set of features coincides with MB. To compute this score, we interpret the set of features you return as a 2-class classification prediction. If you return an unsorted list of features (ulist),we assume all the feature you provide in the list are classified as MB and the others as non-MB, and Fscore=BAC. If you return a sorted list of features (slist), the Fscore is the AUC, using the feature ranking as a discriminative score between MB and non-MB features. If not all features are ranked, non-ranked features are given the same highest rank.
Note: The goal of the challenge is not to discover the MB. The goal is to make best predictions of the target variable on test data (evaluated by Tscore). We use the Fscore only as an indicator, not for determining the winner. There may be a correlation between Fscore and Tscore, but this is not guaranteed.
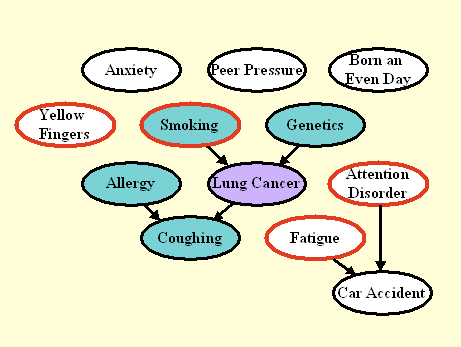
Figure 2: Graph the manipulated test distribution of LUCAS1.
The nodes circled in red correspond to manipulated variables.
By manipulating variables, we disconnect those nodes from their
parents. The Markov blanket (nodes shaded in green) is smaller
then in Figure 1.
LUCAS1: Predicting the consequences of actions
The graph of Figure 2 shows the model we used to generate the test data in LUCAS1. The training data are the same as in LUCAS0. We model in this way a scenario is which an external agent manipulates some of the variables of the system, circled in red (Yellow Fingers, Smoking, Fatigue, and Attention Disorder). The intention of such manipulations may include disease prevention or cure.
The external agent sets the manipulated variables to desired values, hence "disconnecting" those variables from their parents. The other variables are obtained by letting the system evolve according to its own dynamics. As a result of manipulations, many variables may become disconnected from the target and the Markov blanket (MB) may change. If you know which variables have been manipulated (for some datasets we tell you), as long as you have the graph of the unmanipulated distribution inferred from training data, you can deduce easily which variables to exclude from the set of predictive variables. The Fscore is this time based on the MB of the manipulated distribution.
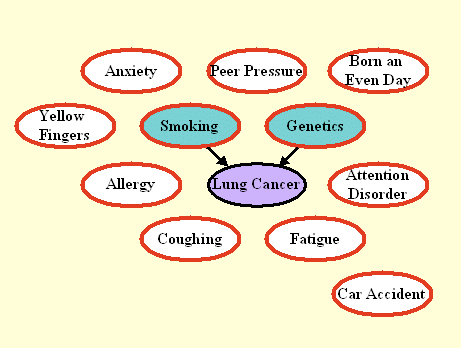
Figure 3: Graph the manipulated test distribution of LUCAS2.
All variables except the target are manipulated. Only direct causes
remain connected to the target.
LUCAS2: Discovering the direct causes
The graph of Figure 3 shows the model we used to generate the test data in LUCAS2 (same training data as LUCAS0). Here we manipulated all the variables except the target. As a result, only the direct causes of the target are predictive, and coincide with the Markov blanket (MB) of the manipulated distribution. The Fscore is again based on the MB of the manipulated distribution. Note that manipulating all the variables can seldom be done in real experimental setups.
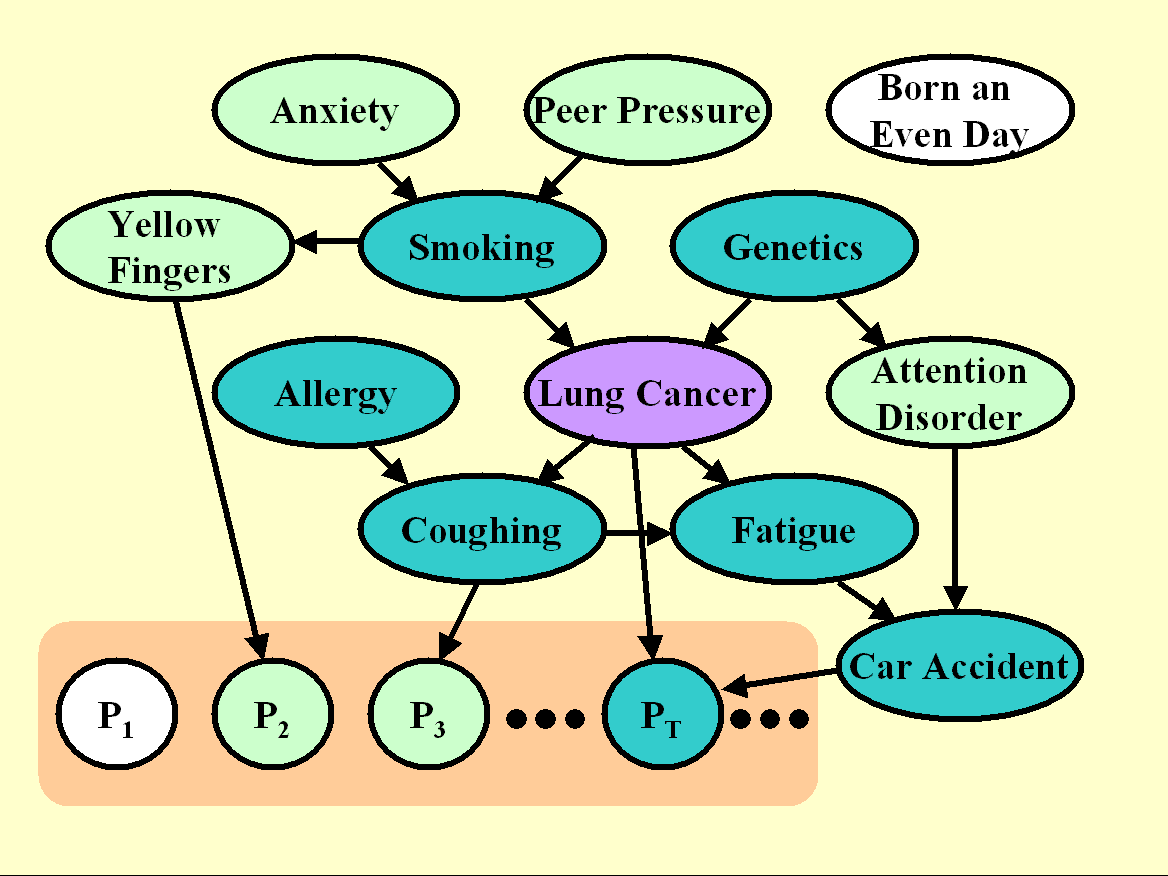
Figure 4: Graph the unmanipulated distribution of LUCAP0.
The Pi variables are artificial "probes", all non-causes of the target.
The graph of Figure 4 shows the model we used to generate both training and test data in LUCAP0. We are modeling the following situation: Imagine that we have REAL data generated from some process, of which we know nothing and in particular we do not know the causal relationships between variables. Further, because of various reasons, which may include practical reasons, ethical reasons, or cost, we are unable to carry our any kind of manipulation on the real variables and we must resort to perform causal discovery AND evaluate the effectiveness of our causal discovery using unmanipulated data.
To that end, we add a large number of artificial variables called "probes", which are generated from some functions (plus some noise) of subsets of the real variables. We shuffled the order of all the variables and probes not to make it too easy to identify the probes. For the probes we (the organizers) have perfect knowledge of the causal relationships. For the other variables, we only know that some of them are eventually predictive and some of them might belong to the Markov blanket (MB). We shade in dark green the members of the MB, some of which are real variables (we do not know which ones) and some of which are probes (we do know which ones).
In this situation, it is not possible to compute an Fscore for evaluating how well a feature set coincides with the MB (since we do not know the MB). Rather, we compute an Fscore, which evaluates the separation between probes not belonging to the MB and other variables.
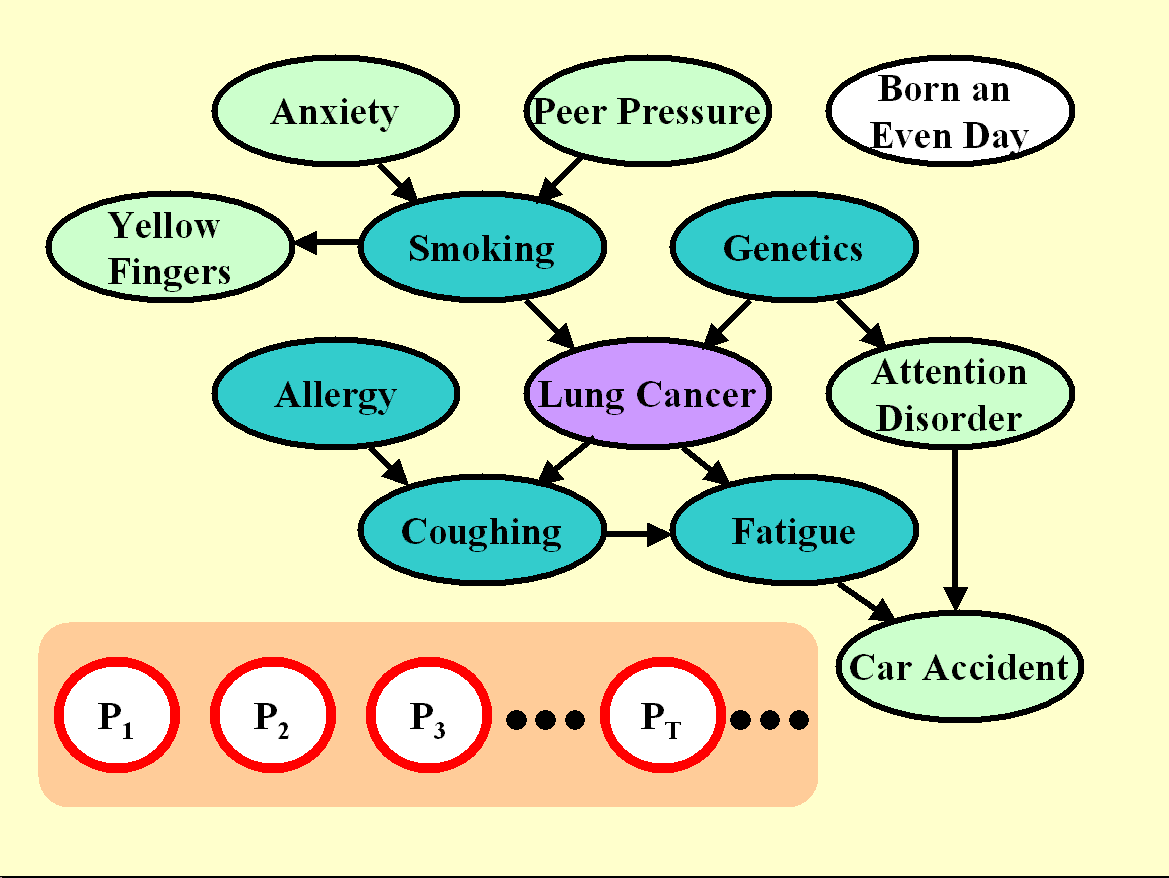
Figure 5: Graph the manipulated distribution of LUCAP1 and LUCAP2.
All the probes are manipulated. Since all probes are non-causes of the target,
none should be predictive. The fraction of probes in the selected feature set
is indicative of the quality of feature selection.
LUCAP1 and LUCAP2: Manipulating the probes to identify the causes of the target
While we cannot manipulate the real variables in our model setup, we can manipulate the probes, and even all of them! We do so in Figure 5. The test sets of LUCAP1 and LUCAP2 are obtained by manipulating all probes (in every sample) in two different ways. The training data are the same as in LUCAP0.
Knowing that we manipulated all probes and that probes can only be non-causes of the target, you should be inclined to select variables, which are causes of the target. The evaluate this, we calculate the Fscore for the separation "real variables" vs. "probes" (i.e. all green variables vs. white ones). If the probes model well the distribution of non-causes of the target and if we have sufficiently many probes, it can be shown that the Fscore is linearly related to the Rscore evaluating the separation "causes" vs. "non causes".