Data donation (track 1)
One way to participate in the challenge is to donate data (data samples for pairs of variable).
DATA FORMAT:
We provide a sample data donation. The data format is explained in the README file.
USE OF DATA:
By submitting data, the data donors agree to put their data in the public domain and grant unrestricted use of their data, subject to being given proper credit. The organizers intend to run the best ranking methods of track 2 on donated data to infer potentially new causal relationships. The results will be made available to the data donors to make scientific discoveries and write their paper. The data donors are allowed to withhold the variable names and the truth values of the causal relationships until their paper is published.
SUBMISSION METHOD:
Email your data with your coordinates and a brief description to causality@chalearn.org before Friday May 17, 2013.
Challenge (track 2)
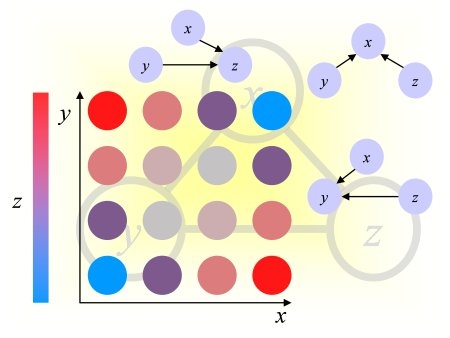
Given sample points for a pair of variables {A, B}, the goal is to determine whether A is a cause of B (denoted A->B) or B a cause of A (denoted A<-B).
DATA PROVIDED:
See the data page.
SUBMISSIONS:
Submissions for track 2 are handled by the Kaggle website, both for predictions and software. We provide a sample csv file containing prediction results. We also provide sample Matlab code and sample Python code. The prediction results should be formatted in the following way: each line represents a variable pair. The pair identifier is followed by a comma then the prediction:
valid1, 0.23
valid2, -0.001
...
valid2642, 2.8
test1, -29
test2, 1.4
....
test7892, 100
Large positive predictions indicate confidence in A->B, small negative predictions confidence in A<-B. Values near zero mean that neither causal relationship can be detected with confidence (there may be a dependency that can be explained by a common cause or no dependency at all).
See detailed instructions for submitting software at the bottom of this page.
SCORING:
For the purpose of this challenge, two variables A and B are causally related if:
B = f (A, noise) or A = f (B, noise).
If the former case, A is cause of B and in the latter case B is a cause of A. All other factors are lumped into the "noise". We provide samples of joint observations of A and B, not organized in a time series. We exclude feed-back loops and consider only 4 types of relationships:
| A->B |
A causes B |
Positive class |
| B->A |
B causes A |
Negative class |
| A - B |
A and B are consequences of a common cause |
Null class |
| A | B |
A and B are independent |
Null class |
We bring the problem back to a classification problem: for each pair of variable {A, B}, you must answer the question: is A a cause of B? (or, since the problem is symmetrical in A and B, is B a cause of A?)
We expect the participants to produce a score between -Inf and +Inf, large positive values indicating that A is a cause of B with certainty, large negative values indicating that B is a cause of A with certainty. Middle range scores (near zero) indicate that neither A causes B nor B causes A.
For each pair of variables, we have a ternary truth value indicating whether A is a cause of B (+1), B is a cause of A (-1), or neither (0). We use the scores provided by the participants as a ranking criterion and evaluate their entries with two Area Under the ROC curve (AUC) scores:
Let Yhat be your predicted score in [-Inf, +Inf] and Y the target values in {-1, 0 1}.
We define Y1=Y; Y1(Y==0)=-1; and Y2=Y; Y2(Y==0)=+1;
Score = 0.5*(AUC(Yhat, Y1)+AUC(Yhat, Y2));
The first score AUC(Yhat, Y1) measures the success at correctly detecting that A->B rather than [A<-B, A-B, or A|B].
The second score AUC(Yhat, Y2) measures the success at correctly detecting that A<-B rather than [A->B, A-B, or A|B].
Since the problem is symmetric, we average the two scores.
The organizers will also compute various other score for analysis purpose, but they will not be used to rank the participants.
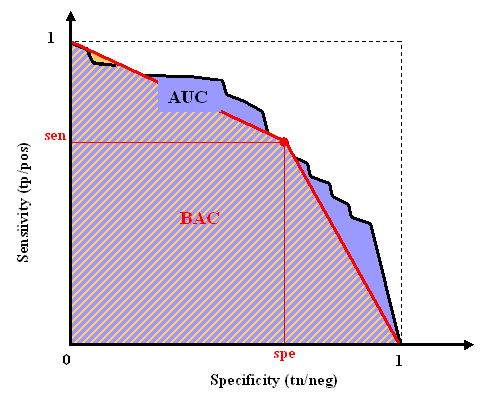
Area Under the ROC curve (AUC)
Consider a classification problem for which the labels are binary +-1. Consider a model returning a numerical predicition score, larger values indicating higher confidence in positive class membership. The results of classification, obtained by thresholding the prediction score, may be represented in a confusion matrix, where
tp (true positive), fn (false negative), tn (true negative) and fp (false positive) represent the number of examples falling into each possible
outcome:
|
Prediction |
| Class +1 |
Class -1 |
| Truth |
Class +1 |
tp |
fn |
| Class -1 |
fp |
tn |
We define the sensitivity (also called true positive rate or hit rate) and the specificity (true negative rate)
as:
Sensitivity = tp/pos
Specificity = tn/neg
where pos=tp+fn is the total number of positive examples and neg=tn+fp the total number of negative examples.
The prediction results are evaluated with the so-called Area Under ROC Curve (AUC), which we refer to as AUC. It corresponds to the area under the curve obtained by plotting sensitivity against specificity by varying a threshold on the prediction values to determine the classification result. The AUC is related to the area under the lift curve and the Gini index used in marketing (Gini=2 AUC -1).
The AUC is calculated using the trapezoid method. In the case when binary
scores are supplied for the classification instead of discriminant values, the curve is given by
{(0,1),(tn/(tn+fp),tp/(tp+fn)),(1,0)} and the AUC is just the Balanced ACcuracy BAC.
Detailed instructions for submitting software
To simplify the verification process, Kaggle is offering to the participants to upload their software to their website.
The participants need only to upload software to make predictions on the final validation and test data. Only the winners will be asked to make publicly available the source code of their full software package under
a popular OSI-approved license, including training software, to be able to claim their prize.
- Submission instructions:
Put your software, including all libraries in a zip archive bearing the name of your team. Upload the archive with your result file at the bottom of the submission page on the Kaggle website using "Attach a model file".
- License:
By submitting their software, the authors grant to the organizers a license to use it for the purpose of verifying the challenge results and carrying out post-challenge analyses on other data, including the data submitted by the participants of track 1.
The authors retain all rights to their software. The organizers will keep the software confidential. However, to be eligible for prizes, the winners will have to make their code available under a popular OSI-approved license.
- Libraries supported:
The authors are responsible to include ALL the necessary libraries with their software. The software should be completely self-contained, unless agreed in advance with the organizers. The authors are responsible to get all necessary licenses and make sure no thrird party rights are violated.
- Platforms supported:
- -- Executable code -- The authors can provide an executable for either Windows 7 or Mac OS X 10.5 or later.
We also recommend that the authors supply source code in addition to their executable, to be used only if the organizers fail to run the executable.
- -- Interpretable code -- The authors can provide interpretable code for Matlab (release R2011a or higher), Java (latest release), Python (release 2.7.2 and higher), or R (latest release).
- -- Other platforms -- The authors should contact the organizers in advance if they want to submit compilable source code under Unix/Linux platforms or other versions of Windows or Mac OS, use other version of Matlab, Java, or Python, use other interpreted languages such as R, use Matlab p-code, use particular Matlab toolboxes or Java and Python libraries.
- Recommendations:
- -- Self-contained package --
Include all necessary libraries.
- -- Syntax --
Please separate the training and prediction functions. It should be possible to run your code WITHOUT RETRAINING, using a provided trained model. The prediction script should load the model and three arguments: CEdata_test_pairs.csv, CEdata_test_publicinfo.csv, and CEdata_test_predictions.csv. The two first arguments are input file names and the last argument is the output file name.
Make sure that log data or intermediate calculations be written to a directory that can be renamed and NOT in the data directory or the code directory. If you want to make several final submissions, add an extra argument to switch between methods.
- -- Absolute reproducibility --
Make sure that the code always returns the same result and does not have any stochastic component. If your code relies on random numbers, draw in advance a sequence of numbers and always use the same one in the same order.
- -- Exception handling --
The code should possess some kind of exception handling such that if it fails on a few pairs, it does not crash but runs on the remaining pairs.
- -- File processing status --
The program should regularly output status information about progress of data processing.
- -- Termination --
The program should end with a message stating that it exited normally indicating the full path and name of the file where the results were written to.
- -- Documentation --
Add a README file with: a contact name and email, your code version and date, installation instructions, type and versions of OS, version of platform (e.g. Matlab) and libraries, usage instructions, compute power you used (processors, memory, disk space) and how long it took to process the validation data, the performance your obtained with that version of the code on validation data (with a lot of digits).
- -- Data --
Do NOT include the data with your software. Contact the organizers if you used extra training data not provided by the organizers and want to donate them.
- -- Test script --
Include a test script that can be run in less than a minute that tests all your code. Some small sample data may be included to run the test script.
- Output format:
The output file "resu_file" should be a csv file in the challenge submission format, such that the organizers can submit the file to the challenge website and obtain the same result that was submitted by the authors of the software.