 |
 |
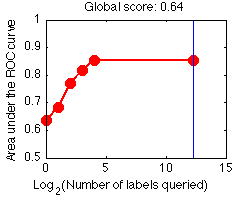
The prediction performance is evaluated according to the Area under the Learning Curve (ALC). A learning curve plots the Area Under the ROC curve (AUC) computed on all the samples with unknown labels, as a function of the number of labels queried (including the seed).
We consider two baseline learning curves:
global_score = (ALC-Arand)/(Amax-Arand)
We show below in red some learning curves for the toy example ALEX, obtained using the sample code, after 1, 5, and 13 queries. We use a simple active learning strategy called "uncertainty sampling" (see the Tutorial), with the very simple linear classifier "zarbi".
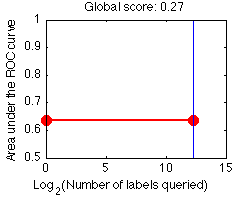
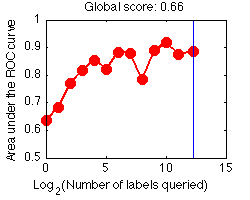
We interpolate linearly between points and, for on-going experiments for which the entire budget has not been spent, we extrapolate the learning curve with a horizontal line. While you could use all your budget at once to purchase all the labels, you will probably get a better global score (ALC) if you make incremental purchases. For illustration, we show the learning curve obtained with such a "passive" learning strategy consisting in purchasing all the labels at once; then "zarbi" is trained to produce prediction results using all the labeled examples:
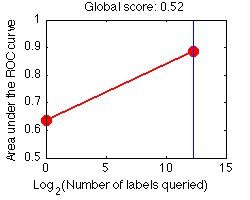
The global score depends on how we scale the x-axis. Presently we use a log2 scaling for all development datasets.
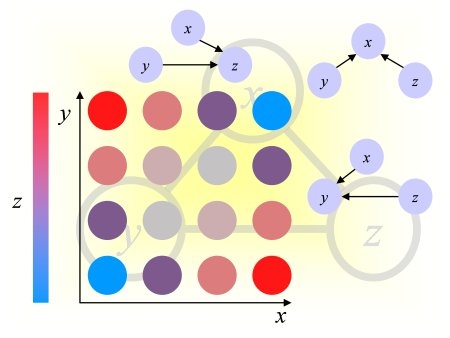
The objective of the challenge is to make good predictions of the unknown values of a target variable (label), for the training examples not queried yet and the test examples. However, for data format simplicity, we ask you to return predictions for all the samples, in the order of the data matrix. The labels are binary +-1 (classification problem). We ask the participants to return a prediction score. Any sort of numeric prediction score is allowed, larger numerical values indicating higher confidence in positive class membership.
The results of classification, obtained by thresholding the prediction score, may be represented in a confusion matrix, where tp (true positive), fn (false negative), tn (true negative) and fp (false positive) represent the number of examples falling into each possible outcome:
| Prediction | |||
|---|---|---|---|
| Class +1 | Class -1 | ||
| Truth | Class +1 | tp | fn |
| Class -1 | fp | tn | |
We define the sensitivity (also called true positive rate or hit rate) and the specificity (true negative rate)
as:
Sensitivity = tp/pos
Specificity = tn/neg
where pos=tp+fn is the total number of positive examples and neg=tn+fp the total number of negative examples.
The prediction results are evaluated with the so-called Area Under ROC Curve (AUC), which we refer to as AUC score, to distinguish it from the global score (normalized ALC). It corresponds to the area under the curve obtained by plotting sensitivity against specificity by varying a threshold on the prediction values to determine the classification result. The AUC is related to the area under the lift curve and the Gini index used in marketing (Gini=2 AUC -1). The AUC is calculated using the trapezoid method. In the case when binary scores are supplied for the classification instead of discriminant values, the curve is given by {(0,1),(tn/(tn+fp),tp/(tp+fn)),(1,0)} and the AUC is just the Balanced ACcuracy BAC.