Causality Causality Workbench                                                             Challenges in Machine Learning Causality

Unsupervised and Transfer Learning Challenge

Evaluation

The data representations will be assessed automatically by the evaluation platform connected to this website. To each evaluation set (validation set or final evaluation set) the organizers have assigned several binary classification tasks unknown to the participants. The platform will use the data representations provided by the participants to train a linear classifier to solve these tasks (details on the linear classifier are provided in the Frequently Asked Questions).
To that end, the evaluation data (validation set or final evaluation set) are partitioned randomly into a training set and a test set. The parameters of the linear classifier are adjusted using the training set. Then, predictions are made on test data using the trained model. The Area Under the ROC curve (AUC) is computed to assess the performance of the linear classifier. The results are averaged over all tasks and over several random splits into a training set and a complementary test set.
The number of training examples is varied and the AUC is plotted against the number of training examples in a log scale (to emphasize the results on small numbers of training examples). The area under the learning curve (ALC) is used as scoring metric to synthesize the results. Other metrics and other classifiers may also be used to compute various statistics and better analyze the results of the challenge, but will not be used for scoring the participants.
The participants will be ranked by ALC for each individual dataset. The participants having submitted a complete experiment (results on all 5 datasets of the challenge) will enter the final ranking. The winner will be determined by the best average rank over all datasets for the results of their last complete experiment.

Global Score: The Area under the Learning Curve (ALC)

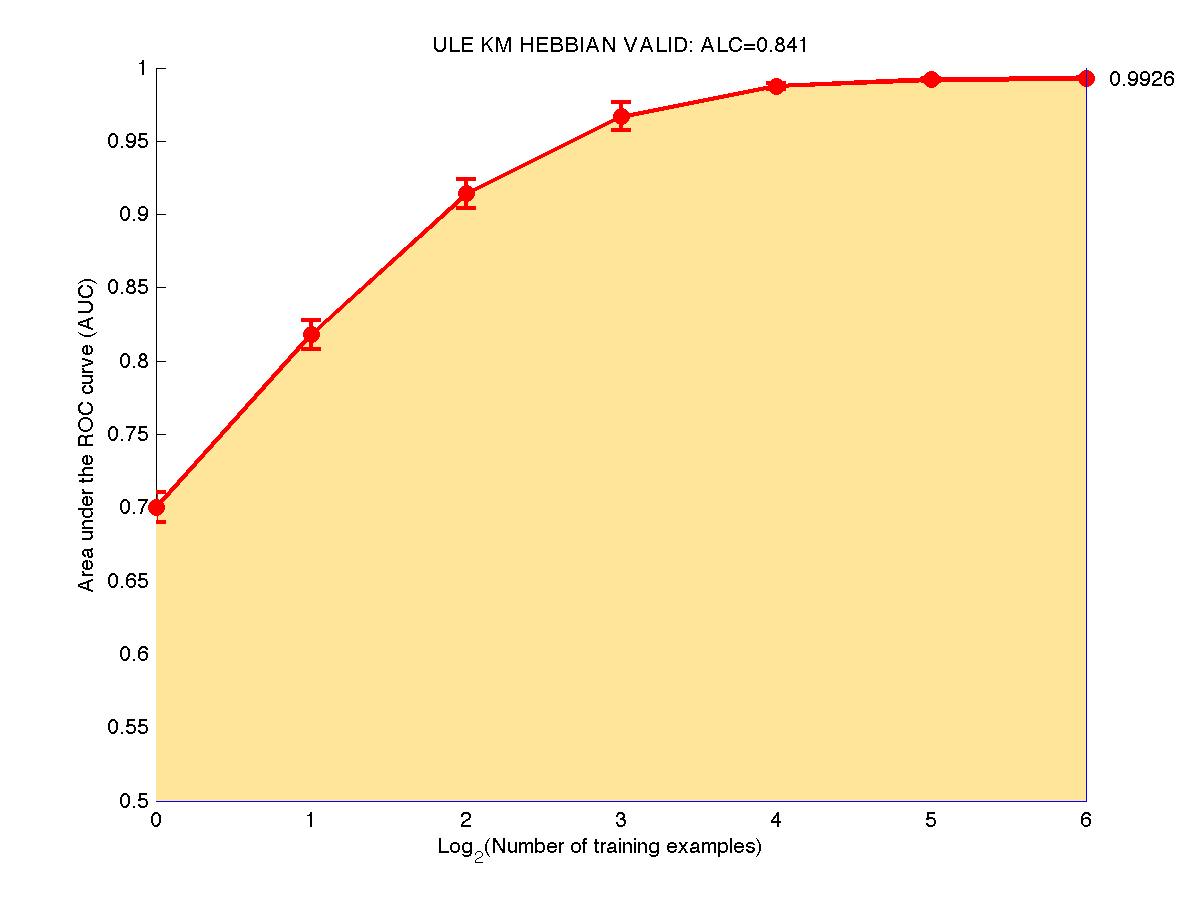
The prediction performance is evaluated according to the Area under the Learning Curve (ALC). A learning curve plots the Area Under the ROC curve (AUC) averaged over all the binary classification tasks and all evaluation data splits.

We consider two baseline learning curves:

  1. The ideal learning curve, obtained when perfect predictions are made (AUC=1). It goes up vertically then follows AUC=1 horizontally. It has the maximum area "Amax".
  2. The "lazy" learning curve, obtained by making random predictions (expected value of AUC: 0.5). It follows a straight horizontal line. We call its area "Arand".
To obtain our ranking score called ALC or "global score" displayed in Mylab and on the Leaderboard, we normalize the raw ALC as follows:
 global_score = ALC = (ALCraw - Arand)/(Amax - Arand) 

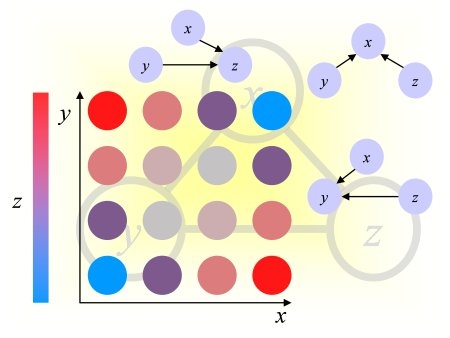
We show below a learning curve for the toy example ULE, obtained using the sample code. Note that we interpolate linearly between points. The global score depends on how we scale the x-axis. Presently we use a log2 scaling for all development datasets.

ULE final

The Area Under the ROC curve (AUC)

The objective of the challenge is to make good predictions of the unknown values of a target variable (label) on a subset of the evaluation data called test set, when trained on the remainder of the evaluation data (the training set). The labels are binary (classification problem). One class is called "positive class" (label +1) and the other "negative class" (label 0 or -1, depending on the convention used). The linear classifier generates a discriminant value or prediction score.

The results of classification, obtained by thresholding the prediction score, may be represented in a confusion matrix, where tp (true positive), fn (false negative), tn (true negative) and fp (false positive) represent the number of examples falling into each possible outcome:

Prediction
Class +1 Class -1
Truth Class +1 tp fn
Class -1 fp tn

We define the sensitivity (also called true positive rate or hit rate) and the specificity (true negative rate) as:
Sensitivity = tp/pos
Specificity = tn/neg
where pos=tp+fn is the total number of positive examples and neg=tn+fp the total number of negative examples.

The prediction results are evaluated with the so-called Area Under ROC Curve (AUC), which we refer to as AUC score, to distinguish it from the global score (normalized ALC). It corresponds to the area under the curve obtained by plotting sensitivity against specificity by varying a threshold on the prediction values to determine the classification result. The AUC is related to the area under the lift curve and the Gini index used in marketing (Gini=2 AUC -1). The AUC is calculated using the trapezoid method. In the case when binary scores are supplied for the classification instead of discriminant values, the curve is given by {(0,1),(tn/(tn+fp),tp/(tp+fn)),(1,0)} and the AUC is just the Balanced ACcuracy BAC.

ROC